ADVENTURE WORKS END-TO-END HACKATHON PROJECT
Claimed "2nd Place" in the Power BI Desktop Dashboard Hackathon with This Dynamic Dashboard!
Data Analysts skilled in SQL, Tableau, Power BI, Phython and Excel @AllenTheAnalyst
Claimed "2nd Place" in the Power BI Desktop Dashboard Hackathon with This Dynamic Dashboard!
This Power BI dashboard visualizes the company's financial story (2016-2019), combining P&L and balance sheet data to track performance and financial health.
Empowered decision-makers with a data-driven Power BI dashboard to proactively manage loan portfolio health and mitigate risks.
As part of the Datasense Certificate project in June 2023, I was tasked with developing a financial dashboard using Power BI
Unveiling Insights and Driving Success with Comprehensive Data Analysis and Visualization.
My task was to gain insights into customer behavior and ATM usage patterns by analyzing the transaction data. The goal was to identify opportunities for optimization and improvement to enhance customer satisfaction.
My task was to analyze customer retention rates, behavior, and market trends to gain insights into customer cohorts.

Conducted data mining techniques and exploratory data analysis on various datasets to uncover patterns, correlations, and insights for salary expectations, automobile factors, and diabetes risk factors.

In this project, I meticulously clean and organize housing data in SQL Server.

Data exploration in SQL Server enables efficient analysis of Covid-19 trends and patterns for better understanding of the pandemic's impact.

SQL Server and Tableau's combination allows for efficient analysis and effective visualization of Covid-19 data, providing a powerful tool for understanding the pandemic's impact.

In this project we look at what variables effect the gross revenue from movies.

In this project, we utilize Python to develop a web scraper for Amazon, allowing us to extract product data.

In this project we make automated file sorter to sort files in a designated folder.

In this project, we automate the retrieval of cryptocurrency data from various APIs to analyze and track real-time price and market data for different cryptocurrencies.

Tableau's visualization enhances data analysis of Airbnb, providing valuable insights into the vacation rental market.
Power BI enhances data analysis of professional survey data, providing valuable insights and clear visual representation.
Showing different variation of Visualization in Power BI using Apocalypse Store data.
Creating data-driven sales campaigns for ecommerce. Tracking of sales trends to optimize inventory and increase profits.
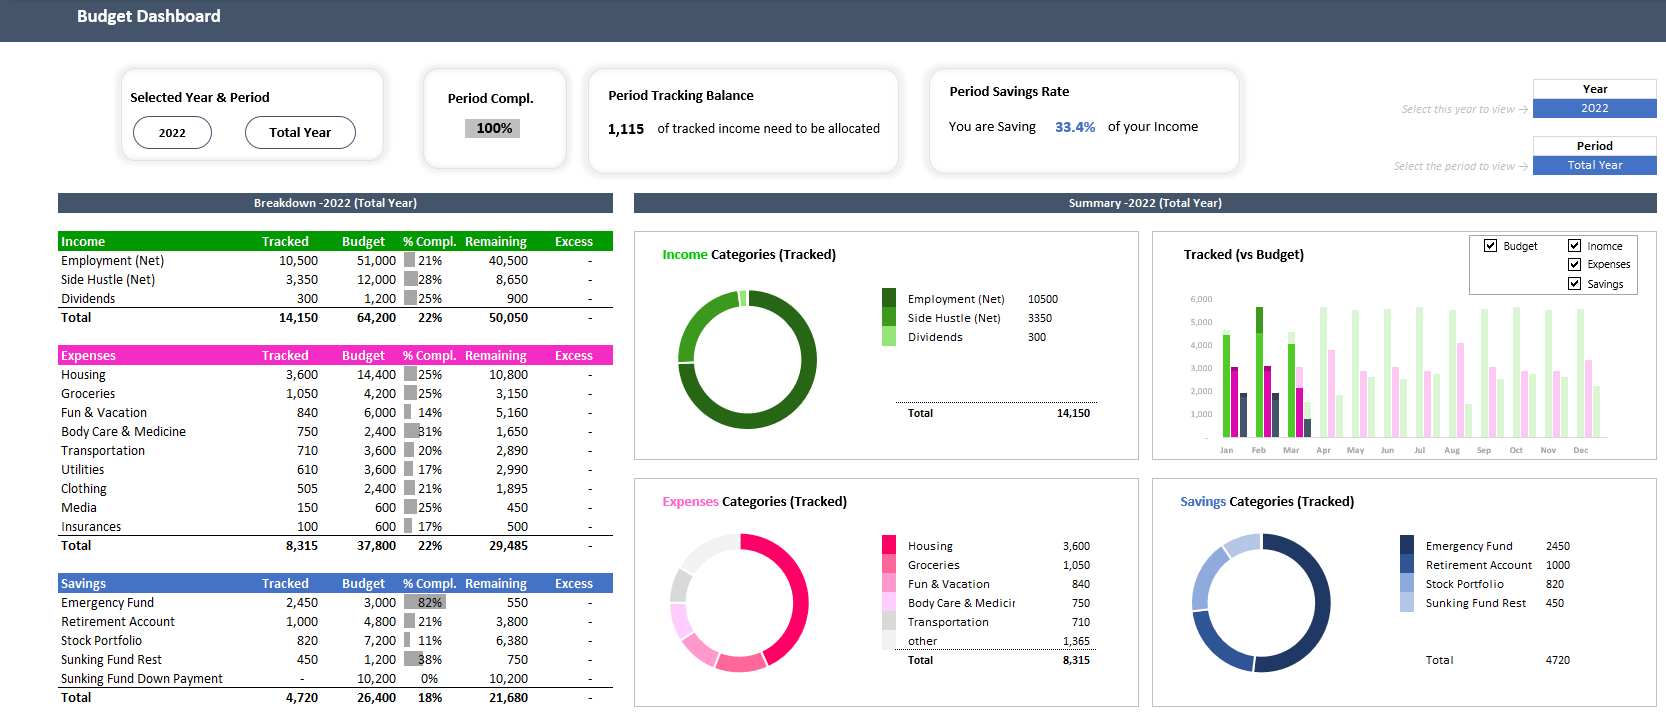
Creating comprehensive personal money manager empowers you to take control of your finances with a range of tools and resources, including goal-setting capabilities, a dynamic budget dashboard, detailed budget planning and tracking worksheets, automated calculation formulas, and user-friendly drop-down menus for easy data entry.
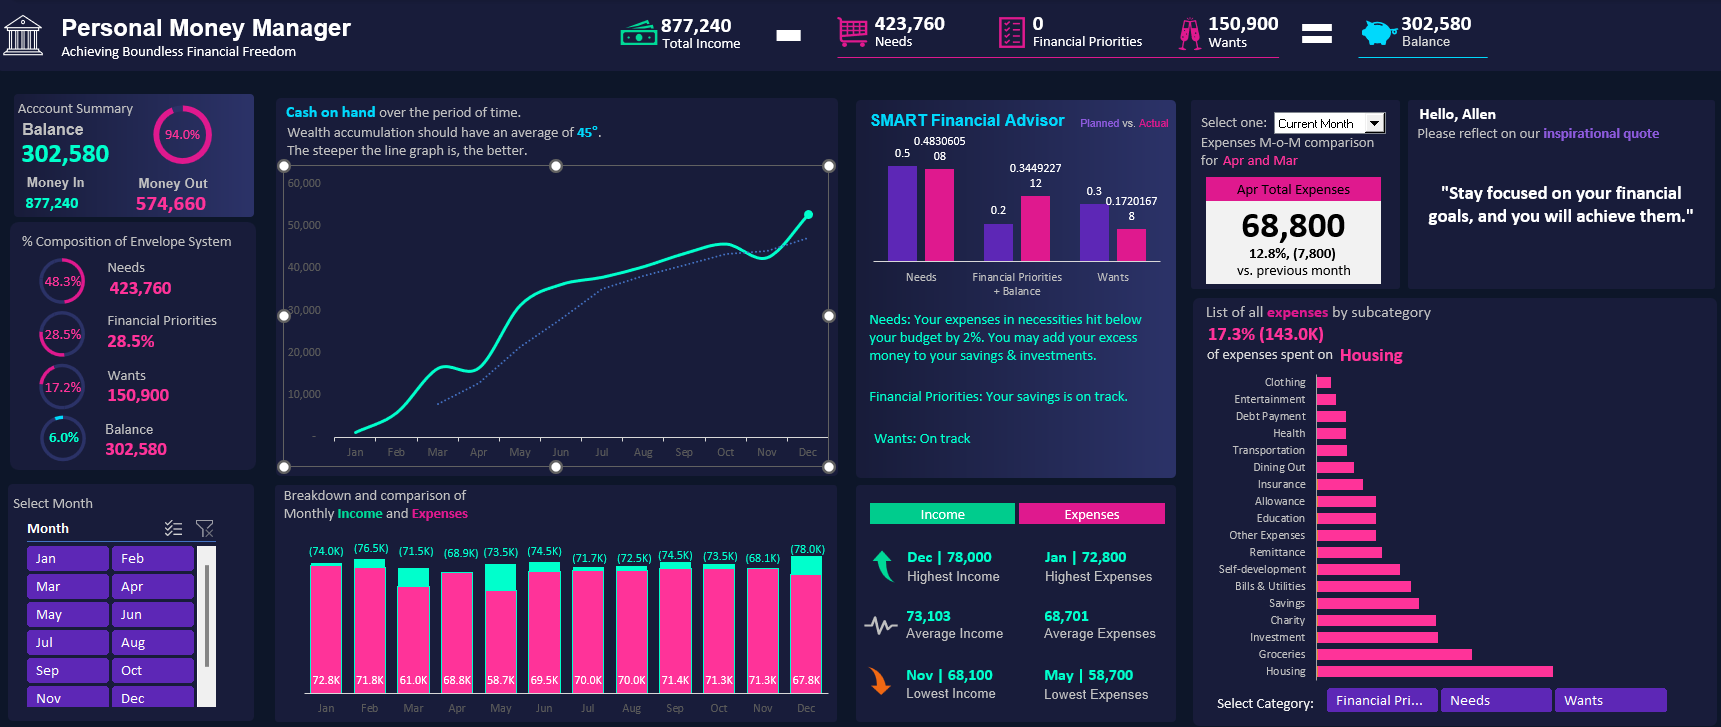
Built a SMART financial dashboard with envelope budgeting, transaction tracking, expense insights, and proprietary algorithm for one-year budgeting.
Interactive Dashboard with a theme Dark & Light.
A financial statistics dashboard in Excel provides comprehensive and dynamic analytics, enabling users to analyze and interpret key financial indicators.

I perform Amazon web scraping to collect and analyze multiple datasets, extracting valuable information and importing it into CSV format for further analysis.
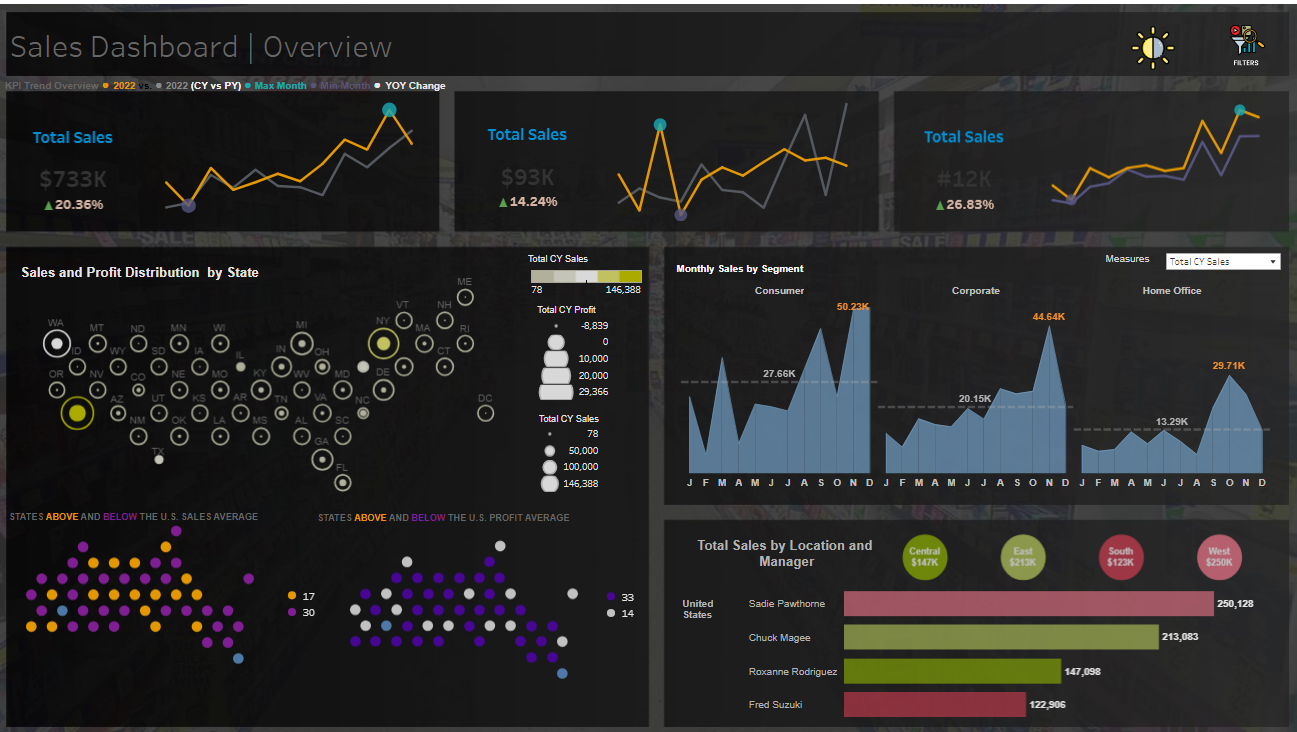
Highly motivated professional with a strong background in data analysis and visualization. Proficient in leveraging Tableau to create impactful dashboards and uncover valuable insights. Skilled in analyzing sales metrics, identifying trends, and implementing strategies to improve performance.
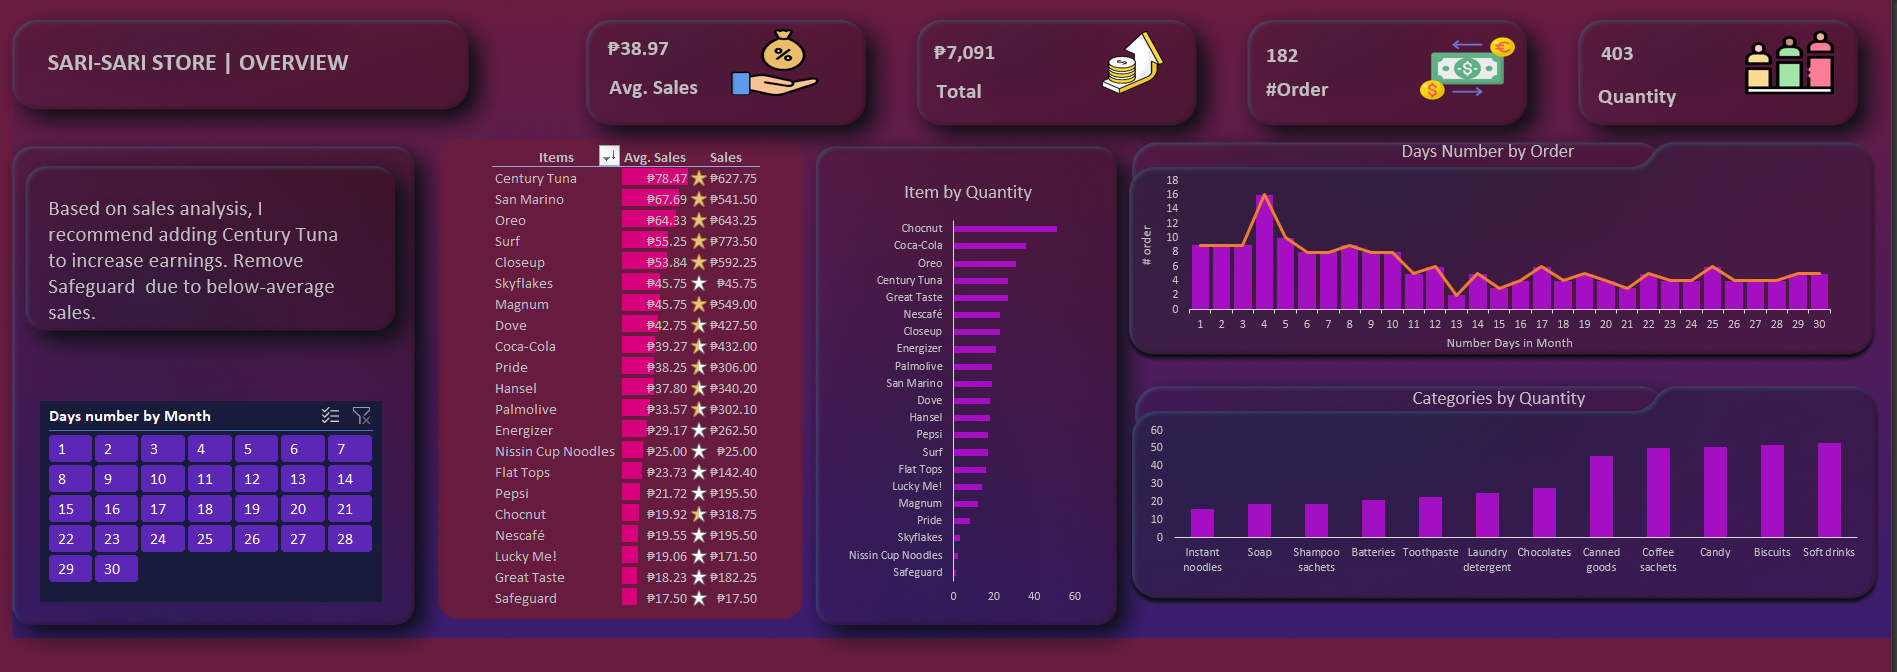
In the fast-paced world of business data analysis, participants in the course 'SP201: Essential Excel Skills for Data Preparation and Analysis' harnessed the power of Excel to unlock valuable insights and craft an interactive financial dashboard for Aling Lala, the savvy business owner.
Philippines, Iloilo City